
Google released a fascinating research paper titled Failure Trends in a Large Disk Drive Population (pdf) at this years File and Storage Technologies (FAST ’07) conference. Google collected data on a population of 100,000 disk drives, analyzed it, and wrote it up for our delectation.
In yet another twist of consumer-driven IT, the disks Google studied, PATA and SATA drives, are the same drives you and I would buy for personal use. As an ironic result, we now have better data on drive failures for cheap drives than the enterprise does for its much costlier FC and SCSI “enterprise” disks with their much higher MTBFs.
Google found surprising results in five areas:
- The validity of manufacturer’s MTBF specs
- The usefulness of SMART statistics
- Workload and drive life
- Age and drive failure
- Temperature and drive failure
I’ll give you the skinny on each after a note about MTBF and AFR.
Vendor MTBF and Google AFR
Mean Time Between Failure (MTBF) is a statistical measure. When the vendor specs a 300,000 MTBF – common for consumer PATA and SATA drives – what they are saying is that for a large population of drives half the drives will fail in the first 300,000 hours of operation. MTBF, therefore, says nothing about how long any particular drive will last.
Ideally, if you had 600,000 drives with 300,000 hour MTBFs, you’d expect to see one drive failure per hour. In a year you’d expect to see 8,760 (the number of hours in a year) drive failures or a 2.88% Annual Failure Rate (AFR). Is that what Google found? Nope.

There’s some discussion of this result in the Age and Drive Failure section, so be sure to keep reading.
Manufacturer’s MTBF specs
The vendors tell us what the MTBF rate is, so what else do we need to know? Quite a bit. Vendors define failure differently than you and I do. And, oddly enough, their definition makes drives look more reliable than what you and I see.
Vendors typically look at two types of data. First are the results of accelerated life testing, which are good at identifying the effect of some environmental factors on drive life, but don’t do a good job of reflecting real world usage. Second, vendors look at their returned unit data. Vendors typically report “no trouble found” with 20-30% of all returned drives, but as the Googlers note:
Since failures are sometimes the result of a combination of components (i.e., a particular drive with a particular controller or cable, etc), . . . a good number of drives . . . could be still considered operational in a different test harness. We have observed . . . situations where a drive tester consistently “green lights” a unit that invariably fails in the field.
Bottom line: MTBF figures are just like any other storage performance statistic: it’s a miracle if you see them in real life.
How smart is SMART?
Not very, as Google found, and many in the industry already knew. SMART (Self-Monitoring, Analysis, and Reporting Technology) captures drive error data to predict failure far enough in advance so you can back up. Yet SMART focuses on mechanical failures, while a good deal of a disk drive is electronic, so SMART misses many sudden drive failure modes, like power component failure. The Google team found that 36% of the failed drives did not exhibit a single SMART-monitored failure. They concluded that SMART data is almost useless for predicting the failure of a single drive.
So while your disk drive might crash without warning at any time, they did find that there are four SMART parameters where errors are strongly correlated with drive failure:
- scan errors
- reallocation count
- offline reallocation
- probational count
For example, after the first scan error, they found a drive was 39 times more likely to fail in the next 60 days than normal drives. The other three correlations are less striking, but still significant.
The bottom line: SMART can warn you about some problems, but miss others, so you can’t rely on it. So don’t. Back up regularly, and if you do get one of these errors, get a new drive.
Over work = early death?
A teenager might want you to believe that, but the Googlers found little correlation between disk workload and failure rates. Since most of us, including enterprise IT folks, have no idea how much “work” our drives do, utilization is a slippery concept. The authors defined it in terms of weekly average of read/write bandwidth per drive and adjusted for the fact that newer drives have more bandwidth than older drives.
After the first year, the AFR of high utilization drives is at most moderately higher than that of low utilization drives. The three-year group in fact appears to have the opposite of the expected behavior, with low utilization drives having slightly higher failure rates than high ulization ones.
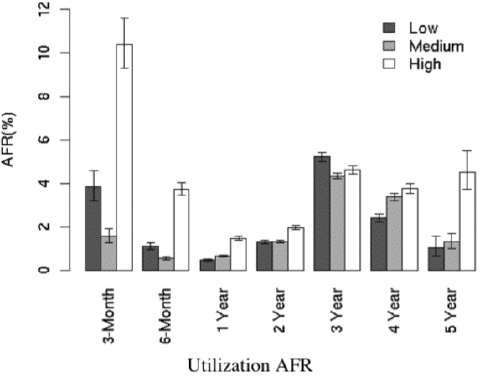
As the graph shows, infant mortality is much higher among high utilization drives. So shake that new drive out while it is still under warranty. And don’t worry about doing those daily backups to disk and other I/O intensive work.
Age and drive failure
This is the most irritating part of the paper, because the team admits they have the goods on who makes good drives and who doesn’t, but clam up due to ” . . . the proprietary nature of these data.” Hey, Larry, Sergey, isn’t Google’s mission to “. . . organize the world’s information and make it universally accessible and useful”? How about right here?
Google buys large quantities of a certain drive model, but only for a few months, until the next good deal comes along. As they say:
Consequently, these data are not directly useful in understanding the effects of disk age on failure rates (the exception being the first three data points, which are dominated by a relatively stable mix of disk drive models). The graph is nevertheless a good way to provide a baseline characterization of failures across our population.
The AFRs are neither as smooth nor as low as vendor MTBF numbers would have you believe.
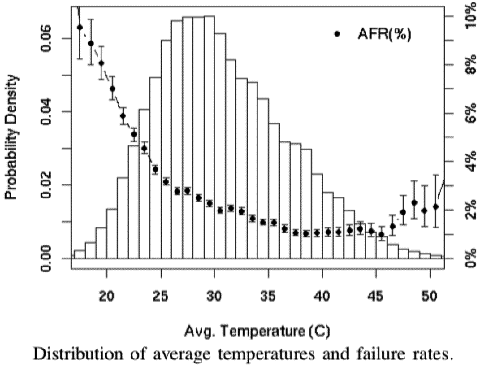
Sudden heat death?
One of the most intriguing findings is the relationship between drive temperature and drive mortality. The Google team took temperature readings from SMART records every few minutes for the nine-month period. As the figure here shows, failure rates do not increase when the average temperature increases. At very high temperatures there is a negative effect, but even that is slight. Here’s the graph from the paper:
Drive age has an effect, but again, only at very high temperatures. Here’s that graph:
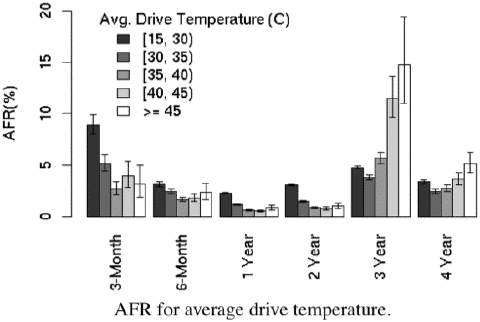
The Googlers conclude:
In the lower and middle temperature ranges, higher temperatures are not associated with higher failure rates. This is a fairly surprising result, which could indicate that data center or server designers have more freedom than previously thought when setting operating temperatures for equipment that contains disk drives.
Good news for internet data center managers.
The StorageMojo take
There is a lot here and the implications may surprise.
- Disk MTBF numbers significantly understate failure rates. If you plan on AFRs that are 50% higher than MTBFs suggest, you’ll be better prepared.
- For us SOHO users, consider replacing 3 year old disks, or at least get serious about back up.
- Enterprise disk purchasers should demand real data to back up the claimed MTBFs – typically 1 million hours plus – for those costly and now much less studied drives.
- SMART will alert you to some issues, but not most, so the industry should get cracking and come up with something more useful.
- Workload numbers call into question the utility of architectures, like MAID, that rely on turning off disks to extend life. The Googlers didn’t study that application, but if I were marketing MAID I’d get ready for some hard questions.
- Folks who plan and sell cooling should also get ready for tough questions. Maybe cooler isn’t always better. But it sure is a lot more expensive.
- This validates the use of “consumer” drives in data centers because for the first time we have a large-scale population study that we’ve never seen for enterprise drives.
On that last, the smart folks at CMU did a study that sheds light on that very point. Look for coverage of that paper here in StorageMojo RSN.
Update: Alert reader Julian points out in his comment below that I assumed the Mean TBF is equal to the Median TBF in my calculation of the AFR, and that I got the arithmetic wrong. He is absolutely correct. The mean tells us nothing about the distribution of failures: half the drives could fail on day 1 and the other half could last 10 years and we’d still have the same MTBF. With the “ideally” qualifier, I was attempting to suggest that if failures were evenly distributed over time, there would be one failure per hour. But that is a big “if” and as the Google data show, not how disks fail in the real world. Also, I fixed my arithmetic, so the vendors look even worse.
Update 2: Almost 4 years to the day after I posted this an alert reader pointed out a mistake in the AFR calculation above. Here’s the correct formula, courtesy the fine folks at Seagate. Take the MTBF in hours and AFR =1-(EXP(-8760/MTBF)). I corrected the post. End update.
Google curious???
How do those bad boys build the world’s largest data center? Check out Google File System, Google’s BigTable Storage System, Architecting the Internet Data Center and Google vs Amazon: A Choice Not An Echo. There’s more, so don’t be afraid to rummage around.
Update: NetApp has responded. I’m hoping other vendors will as well.
Comments welcome, as always. Moderation turned on to limit spam. You’ll just have to find your free ringtones somewhere else. Sorry.

This was a very interesting article, and had a few surprises for me. I am afraid, however, that the description of the statistics needs a little tweaking:
“for a large population of drives half the drives will fail in the first 300,000 hours of operation.”
The metric you describe metric would be the “Median Time Between Failures” rather than the “Mean Time Between Failures”.
“Ideally, if you had 300,000 drives with 300,000 hour MTBFs, you’d expect to see one drive failure per hour.”
If you had one drive fail per hour, you would have an Median AND Mean of 150,000 hours. This makes the manufacturers’ claims even more out-of-whack with the data that Google collected.
I thought MAID was for power saving, not increased reliability.
A drive reclamation operation in VA once told me most drives he saw failed in 18 months or less. Period. I challenged his stats , but he didnt care because thats what he saw.
The main issue here is that drives fail mostly due to old age, which is not something that was evident before these studies.
ANd this is importnt because of how manufacturers assess MTBF. You can’t expect them to get the newest and greatest tech out of the lab, build a thousand drives and get them working for five years before starting to sell them in order to obtain a reliable MTBF. What they do is to put a large number of drives under load for a short period of time (usually weeks, a few months at most) and then calculate the failure rate and derive the MTBF from that. And that method only works if failure rate was constant with age! But since it is not, it is obvious they’ll be understating the MTBF for anything other than the first few months of a drive’s operating life.
The morale: accountants usually write down disks after three years. And this time they are right. Replace disks after three years even if they are working fine if your data is critical.
Does anyone have data re. brand vs. failure rate? That statistic that Google chooses to guard? Surely the data recovery folks would have something to say about brands…
StorageReview.com has a reliability database that includes manufacturers and models. But no raw data is available, and I’m not sure how they arrive at their figures.
Some slashdotter did a little analysis of their own, and noted that google say “more than 100,000” drives were analysed. They managed to come up with a number of 830,000 for this survey, which makes this data even more impressive.
http://slashdot.org/comments.pl?sid=222978&cid=18058500
This paper totally misses the correlation between workload and failures rates of SATA/PATA drives since it does not adequately define or, more importantly, cannot control workload. For the past nearly 3 years, we have been studying the failure rates of drives in our deployed MAID storage used for non-transactional persistent data applications (backup, archive, etc.) where the drives are completely powered off at least 75% of the time. Thus far (results to be published) we are seeing failure rates that are much lower than drive vendor specs — and definitely much lower than what Google reported. Properly designed MAID systems not only saves energy but also increases drive life!
Drive brands are not as correlated to failure rates as drive model numbers. Major storage vendors may have favorite vendors, but they qualify by disk model. A disk model upgrade generally involves a major firmware change in addition to hardware and manufacturing process changes, and these are subject to the same kinds of problems as any major OS+hardware upgrade. It is not unheard of (though rare) for one model from a reputable disk manufacturer to have ten times as many failures in the field as another similar one.
First of all, don’t be overwhelmed by “best” papers. At least one CMU paper has won a FAST best paper award in the recent a few years, and you can guess why from the PC members. Another thing is it is not uncommon to see flawed conclusions in FAST’s best papers, e.g., the FAST 2004 best paper from NetApp on RAID-6 ( more important now) is fundamentally wrong in technical points, because the PCs simply didn’t (or want to) find some obvious qualified reviewers. This is a club system ( and I have to disclose that I am a member of them, so no complains from me …)
That being said, this year papers from CMU and google do have their indisputable values. They show by real system data that disks are not so reliable after all. One of course wouldn’t be so naive to believe his/her disk can last hundreds of years in real systems. ( A sideline, you can find some statistical data on CD and DVD lifetime from a post at Storage Advisor’s blog, another good storage site. )
A more important question an IT manager faces is how much reliable is enough and how to realize this in system set-up, e.g. google guys choose triplication. Disks evolve, in a few years hopefully, we will see reasonable priced holographic HDs with much bigger capacity and lifetime, but as many people here already said, storage systems fail not only due to disks, but too many other factors, thus the architecture issue always will be there. One way to go may be more smartly clusterred systems, a favorite theme here. Again, triplication is not a good solution in long term, even for google, simply due to too much management, space and power costs. RAID-5 can be easily extended to a clustered system. How about RAID-n ( n > 5 )? The truth is so far, technical we ( both academia and industry ) don’t have a sound solution. Current existing RAID-6 or RAID-7 needs too much CPU and thus causes high I/O latency and low thoughput. This is part of the reason array vendors are not pushing you RAID-6 products. Any one here can provide real RAID-6 experiences?
Back to data loss: a piece of data can lose even though the host disk in whole still functions. This is the so-called sector error. The google paper mentioned it a bit by “scan error”. This is much more common and happens much more frequently from whole disk failure. The effect though is the same, if your data happens to be stored on that failed sector. In this sense, the CMU and google papers are just a beginning. If they are good, they should continue to explore the sector error statistics, which certainly will be much harder. This year’s ACM SIGMETRICS 2007 will have a paper from NetApp on this and hopefully this group of people have done a better job than the FAST 2004 group. ( The paper’s title is : An Analysis of Latent Sector Errors in Disk Drives, see http://www.cs.cmu.edu/~sigm07/ )
Oh, well, I will stop here to see if any one from EMC or NetApp or other start-ups can provide their views on systems …
Just a note… in our educational data center we had a short period where we turned off the servers when there was a 3 or more weeks holiday. We stopped doing that because most drive problems began just days after the holidays. Restarting the server farm resulted often in several crashed disks. ( in the Conner dominated years, a hit with a screwdriver sometimes made drives available again. But only to make a quick copy of the data.)
Nowadays the servers keep running during those weeks and besides the used power there are no negative side-effects.
If the drive is a lemon, it will fail sooner. Otherwise, you might get lucky with your new drive.
(300,000/24×365) = 34 years with my calculator.
Where can I get one of those long-lived hard drives ??
30,000 hours, maybe ??
A hard drive is a magnetic device. After 3 years the earth’s magnetic field “can” have an effect. I know a tech who does a total backup of a drive. Then reformats and restores the backup every 2 years. You should never put a large audio speaker to close to a TV OR a hrad drive. I suspect bad/faulty shielding of other internal equipment could also be a factor.
Seagate produces hard drives which are designed for use in digital surveillance systems. They have low power requirements, quick spin-up times, ultra low power save modes and lower heat dissipation than most other drives.
Does anyone know anything further about these drives. The reason I ask is because we have quite a few of these drives currently in production. They cost a little bit more than other models. We imagine that these improvements increase the longevity of these drives. We would be happy to report back in 5 years.
More information on these drives is available from the Seagate product url.
If you are concerned about your most important digital assets after reading this article, please contact us.
All the best form the Lucid Team.
…we are seeing failure rates that are much lower than drive vendor specs — and definitely much lower than what Google reported…
Aloke, your findings are actually perfectly consistent with the Google Report. You have to look at what the term “age” means very carefully. For Google’s statistics, they are looking at drives that are always and without exception “on”. A drive’s “age” in the Google Report and its runtime in years are both exactly the same thing. If one were to suppose that the correct age of a drive were its runtime in years only, and not its chronological age, the MAID findings would be perfectly consistent with Google’s data.
Joe Kraska
BAE Systems
San Diego CA
USA
Last Month in my office something strange happend. I have IBM System Storage DS3400 has RAID-6. All 6 HardDisks crashed simultaneously. Power Supply, Room Temperatures were fine. & to my Surprize crash happened @ 4am when office was closed. How you can explain this?
This has not been consistent with my experience. I have owned several computers and operated all of them for over three years, and have never had a single hard drive failure. Software is far and away the most common source of failure, followed by CD/DVD drives (which I will be happy to see go the way of the Floppy) and monitors. Knock on wood, hard drives have been flawless so far.
I read this paper and agreed that most parameters of Googler’s SMART are reflecting the claimed points such as the fact whenever one scan error and one reallocation error happened on a drive it is indicaton of drives starting to degrade till die very soon very likely. However, there are two critical parameters that SMART is missing, which probably makes it not be able to predict the other half population of failed drives showing no sign of SMART parameters. They are:
1. Power supplier’s surge fluctuation statistics. SOC of HDD is running very high frequency with very low power and high voltage-surge vulnerability in the operation field. Even though SOC has internal surge pretection and voltage regulator circuitry but they all have certain limitations. This could be a reason why some disk drives found failed on site but consistently found ‘green lights’ on the tester in the return-vendors’ labs. Power surge is hard to dupulicate but can easily be ignored. Not to mention that in the data center clusters of millions of drives (tens of thousands of servers) stay in the same site using various power plugers.
2. Pre-ECC number of Byte/Symbol error counts of sector in comparion with a specified threshold is vailable for the HDD HDC to report to the end user as a parameter. It becomes much more countable than scan-error counts because it reflects more likely randomness spectrum of user data than the fixed signal pattern used in error scan. The statistics of Pre-ECC error counts will be much more trustable in predicting the drive degradation performances. For instance, the disk drive having an average less than 8~10 Pre-ECC error counts is much more reliable than the one having more than 10 Pre-ECC error counts which are still within the range of the ECC correction capability; both drives could have no sign of SMART and have no post ECC error but apparently the latter one begins to degrade and fail.
With these two more parameters taken into account in addition to SMART parameters, I believe you the failure trends in large disk drive population will start to show some hidden correlations somewhere in your statistics mapreduce graphs.
Are there any similar studies of correlation of affect of humidity, dust, pollution on the life of disks? there seem to be a lot of it here in developing countries.
I was aware of Google’s paper since it first became available and have re-read it several times when I had a point to make to someone about drive reliability. But having just run across your site from a Google search for some related matter, I must say I had some serious belly laughs over your synopsis of this paper. Thank you for the insight and keep up the humor.
“Vendors define failure differently than you and I do. And, oddly enough, their definition makes drives look more reliable than what you and I see.” Classic!
Hi Robin. I think you are out by a factor of 2 (roughly) and this misinformation is now being spread by the Wikipedia page for
Annualized Failure Rate, which links to and quotes from this
page.
Look how Seagate calculate AFR from MTBF at
http://enterprise.media.seagate.com/2010/04/inside-it-storage/diving-into-mtbf-and-afr-storage-reliability-specs-explained/
1 – e(-8760/300000) is an AFR of approx 2.88% so you should
expect 17267 drive failures annually from a population of 600000,
not 8760.
Rockmelon,
Boy, is my face red! You are absolutely correct. I’m surprised since the post has been up for years.
Anyway, I’ll update it. Thanks for the catch! And more later.
Robin
When this paper came out, I (and a lot of others) gave it a lot of credence.
After having a look at how Google deploys disk drives, I reach the conclusion that this study is nearly meaningless. One cannot draw any conclusions whatsoever from reliability data taken from a pool of disk drives that are (literally) velcro taped to a rattling sheet of tin. Actually, it’s worse even than that…see the photos:
http://news.cnet.com/8301-1001_3-10209580-92.html
That google’s disk drive population performed as well as it did, under these ridiculous environmental conditions, seems a tribute to the robustness of the technology.
KD Mann
MTBF is Mean Time Between Failures
The defintion described here is MTTF, Mean Time To Fail
MTBF describes the time between two failures, hence the word BETWEEN. This value is only a valid entity during the normal life span of a component, and not during Burn-In or Ware-Out, a so called Steady State variable, derived from the statistics
And the math is easy to simplify. If you n drives with MTBF of 300000 hours, then the MTBF of you complex would be 300000/n hrs.
Well, I cannot figure how the temperature / error statics are made. It seems that drivers in cold temperature will fail easially.
I get an idea, that hard thing would be changing temperature, like that drivers are in cold and then get in use sometime warming up. And after that cooling down again for next loop.
Well what you do think about that?
KD Mann, check the date of that article.
Methinks thou hast been hoodwinked.
Hi Robin. I think your math is still a little off. According to your article the AFR should be 8,760 / 600,00 = 1.46% (which I think you did have originally). With an MTBF of 300,000. the expected failures in your example would be 17,520 after one year, and the AFR would be 2.92%.
A few examples using MTBF correctly:
1) With 150,000 devices, each powered on 24 hours per day, each with an MTBF of 300,000 hours, you would expect to see 4,380 failures per year, or on average one failure every two hours. This is an AFR of 2.92% (4,380/150,000).
2) With 300,000 devices, each powered on 24 hours per day, each with an MTBF of 300,000 hours, you would expect to see 8,760 failures per year, or on average one failure every hour. This is also an AFR of 2.92% (8,760/300,000).
3) With 600,000 devices, each powered on 24 hours per day, each with an MTBF of 300,000 hours, you would expect to see 17,520 failures per year, or on average two failures every hour. This is also an AFR of 2.92% (17,520/600,000).
4) With 150,000 devices, each powered on 12 hours per day, each with an MTBF of 300,000 hours, you would expect to see 2,190 failures per year, or on average one failure every four hours. This is an AFR of 1.46% (2,190/150,000).
5) With 300,000 devices, each powered on 12 hours per day, each with an MTBF of 300,000 hours, you would expect to see 4,380 failures per year, or on average one failure every two hours. This is also an AFR of 1.46% (4,380/300,000).
6) With 600,000 devices, each powered on 12 hours per day, each with an MTBF of 300,000 hours, you would expect to see 8,760 failures per year, or on average one failure every hour. This also is an AFR of 1.46% (8,760/600,000).
If their drives died early they were likely using Seagate drives that failed or seized up due to firmware issue. I have seen parts of Dell go down due to entire RAID arrays failing when Seagate struck on several drives in a short period of time. The same thing happened to consumer models. Ever wonder why Seagate drives are so cheap, now you know. Don’t buy.