If SSDs are so great, shouldn’t we see the results in TPC-C benchmarks? They are, and we do.
But there are some surprises.
Cost
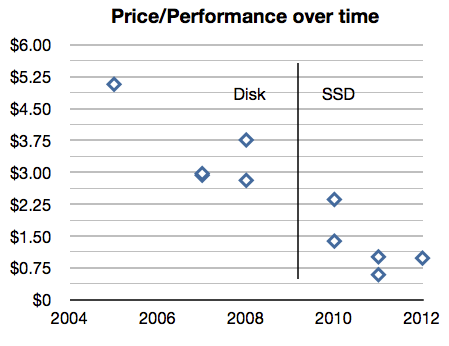
Looking at the TPC-C top 10 performance results showed the dramatic impact SSDs have had on the cost per thousand transactions (tpmC).
- There are no top-10 disk-only results after 2009.
- The most expensive top-10 SSD result is some 15% cheaper than the least expensive disk-based result – and the other SSD results are much less.
- No top-10 results posted during 2009 – the depth of the great recession.
Capacity
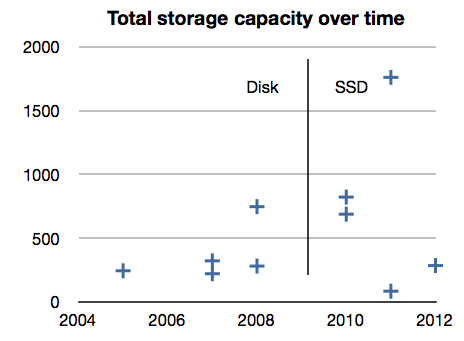
The conventional wisdom has it that disks must be way over-configured to get enough IOPS. You’d expect to see disk solutions have a lot more capacity than SSD solutions in top-10 results.
But we don’t:

The highest capacity – 1760 TB – is for an Oracle SSD-based solution. Yet the lowest capacity solution – 83 TB – is also SSD-based and is also the cheapest per tpmC.
Are we seeing issues with the rest of the infrastructure?
The StorageMojo take
I’ll be taking a deeper dive into the data, but perceptions may be at odds with what this limited set of performance focused benchmarks is showing us.
Readers: what do you think?
Courteous comments welcome, of course. Events beyond my control have reduced StorageMojo’s usual posting frequency. Hope to get things back to normal over the next several weeks.


There’s another dimension to consider here. SSDs have some less than ideal behaviour as they age. Take a look at the first graph on this page: http://www.acunu.com/blogs/irit-katriel/theoretical-model-writes-ssds/
The numbers change, but this “write cliff” pattern happens with many devices: on a random workload, SSDs only maintain their impressive performance until the total amount of data that has been sent to the device is about the same as the total size of the device. After that, you see write performance dropping by half or worse. Deleting data (TRIM or similar) does not help.
(Most performance benchmarks of SSDs fail to write enough data to show this effect.)
Here’s my hypothesis: the use of large amounts of SSD capacity may be an effort to defer this issue. Does TPC-C write enough data?
Andrew, the problem is not aging, but rather the internal fragmentation of data. This is why the first write cycle of every SSD is always the best in terms of performance.
And that is the underlying explanation for the results in the link you put.
TRIMing data should definitely help this problem, but it’s not magic.
If you TRIM enough data so you get enough internal provisioning, then fragmentation will have much less effect.
If you don’t, then it won’t. That simple.
So the real questions should be whether TPC-C was run on “fresh” SSDs, and if not – did the SSD usage during the TPC-C run reflected the actual usage during most of its lifetime (using a DB application of course).
And if we’re talking TRIMs, we also need to ask ourselves whether running it on SSDs that support TRIM can even be fairly compared with runs on regular disks, considering the fact that TRIM benefits are very much host and application -dependent.
You really must look into what Sam and Doug at easyco.com are doing with SSDs. I’ve used their systems, and they’re nothing short of amazing.
We recently replaced a $60K dual 2GHz quad-core HP server with 68x72GB 2.5″ 15K SAS drives with a comparable Supremicro machine having just 8x256GB SSDs (and 5x3TB 3.5″ drives in RAID5 for bulk storage in Samba shares), and the SSD machine was at least twice as fast as the all rotating storage machine.
So that’s twice the speed for half the price.
Much as I would love to get into a detailed discussion of what’s going on here, NDAs prevent it. But I can say that getting good performance out of SSDs after the initial period is a tricky problem that, as of last summer, nobody would publicly admit to having solved.
Agreed on what we need to know about TPC-C tests. We also need benchmarks to be large enough to show the “normal lifetime” behaviour.
From the FDR, page 9:
“The following verification items were given special attention:
• The measurement interval was representative of steady state conditions
• The reported measurement interval was 134 minutes, 29 seconds”
http://tpc.org/results/fdr/tpcc/Oracle_X4800-M2_TPCC_OL-UEK-FDR_011712.pdf
It’s quite easy to avoid the so-called write cliff: don’t measure SSDs until they reach a steady state for your workload. 🙂 With constant workloads such as TPCC, this is both easy to do, and a necessity if you want to pass the audit.
Regards,
Lisa
TRIM is a stopgap and is counterproductive for enterprise workloads as it both consumes controller bandwidth and actively administers time intensive IO (block erasure) with limited knowledge compared to what the SSD controller knows about the block.
The real way to solve SSD performance problems is to over-provision the flash to the extent that the flash erase rate can outpace the desired write rate even when the disk is “full”. SSD makers are already doing this of course some with as high as 2:1 (or even configurable) ratios, but its the key to performance problems. As cost of flash continues to decline and people start to understand the actual problems instead of simply shopping for “TRIM support” and being wowed by initial out-of-the-box performance numbers with benchmarks that dont measure this critical aspect of performance then we will start getting better gear.
At a marketing level a big shift would happen if benchmarkers and vendors would also start publishing IOPS and throughput numbers on 100% full devices. It’s a relatively simple thing to check the erase performance of an SSD this way. The SSD manufacturers could also simply quote maximum erase rate in the spec sheets since they already know it.
One thing that I have not investigated but would like to is whether or not it is possible to effectively mitigate this problem by leaving unprovisioned space on a normal commodity SSD that uses a controller that already does some of this (SandForce) .. For example, use 265MB SSDs but only create 128MB partitions.
IOPS : Number of Spindles :: Erase rate : Number of NAND Blocks
Following up on my own post above, it does seem that artificially limiting the working set size on most SSD does impact the penultimate write performance. See http://www.ssdperformanceblog.com/2011/06/fusionio-320gb-mlc-random-write-performance/ and previous articles showing this effect on Fusion IO and Intel devices. It’s interesting that they follow different performance characteristics. I would like to see a Sandforce device taken through the same test.
After skimming the executive summaries of the non-clustered, top ten, seems like the ones with the lowest Price/tpmC are all “hybrid” SSD + mechanical HDD servers.
I say hybrid because there are a substantial number of SSDs and HDDs in each server.
Perhaps some patterns of IO are better suited for mechanical HDDs vs SSD.
NOTE: clustered results should be treated separately.
Hi Robin,
Quick note on the comment of the surprise of the disks not having more capacity than the SSD submissions. That is part of the test design that held SSDs back from pre 2009 submissions. The higher the performance, the higher the required storage capacity. See slide 13 here: http://www.energystar.gov/ia/products/downloads/Lane_Pres.pdf for some good rules of thumb, do some quick dimensional analysis and you can see that ~7 IOPS/ GB is the “object intensity” of the TPC-C workload. This kept unrealistic performance:capacity configurations from being tested. That requirement makes SSD leadership here all the more impressive.
If you want to think on this more, consider that the minimum capacity that disks make economic sense a compared to SSDs is rising and the IOPS per disk is flat (more discussion on this here: http://storagetuning.wordpress.com/2011/09/01/emlc-part-2-it%E2%80%99s-about-price-per-gb/). Taken together the minimum object intensity for going with SSDs is falling. This has bearing on applications where the capacity does not grow faster then the performance requirement.
Jamon Bowen
I think the move really comes down to how much more efficient you can get when your tiering is done at the application level rather than the storage level. Moving rows of data around in a database between tiers vs moving blocks around.
Of course this level of intelligence is really hard to get right!
Kind of sad to see that MSSQL can’t break into the top 10 even when there is an IBM system there from over seven years ago on the list, though looks like they managed to edge in at 10th place in the non clustered results (can MSSQL be clustered ? I don’t know, I think it can).
There was part of a paper released recently that talked about using lasers to write to magnetic media which apparently would not only increase disk storage space by a large amount but dramatically improve performance at the same time. If such technology gets it’s kinks worked out(apparently they didn’t mention how they could read the data back – which makes it good for archiving, store a ton of data and in the future you can probably get the technology to read it back 🙂 , could we see the performance swing back towards spinning rust powered by light? Perhaps even get to a point where the laser from the fiber connection(or SAS or whatever) goes directly to the platter? (not sure what that may get you, if anything useful)
Some academic types recently wrote a paper titled the Bleak Future of SSD. I have no idea if these are students or PHDs, or whether they know what they talk about. I would have checked with Intel engineers to make sure they take into account some of the latest advances before writing such a bold title. But they make a compelling case that as SSDs get larger the reliability, speed, and endurance drops off.
http://cseweb.ucsd.edu/users/swanson/papers/FAST2012BleakFlash.pdf
Darren, I discussed the paper at a high level on ZDNet: http://www.zdnet.com/blog/storage/the-dismal-science-of-flash/1617
To my knowledge no one in the industry has disputed their basic points. This is why ReRAM – resistance RAM – is, IMHO, the likeliest successor to flash in computer storage applications.
Posting on StorageMojo has been sparse the last few months due to the press of other business and illness. But I’m planning to write about my favorite papers from FAST ’12. The Bleak Future of SSD is one of those.
Did anyone read? MS no longer uses TPC-C because it’s too NARROW of a test and not realistic, nor does it take into account hardware changes over the last 20 years. So looking at TPC-C, it’s not that MS doesn’t make the list, they no longer use an outdated spec to run against. Look at TPC-E, or run your own TPC-C testing. Going back to when MS did release numbers, it still was in the #1 spot from 2001 to 2007! (in 2007, MS changed to use TPC-E, therefore no more TPC-C numbers produced).